Selected work

The work speaks. Numbers follow.

Real client results, evidenced with Google Search Console reports. Client names are anonymized on request; metrics are unedited screenshots straight from the source.

Local Services · Multi-city Live result

Anonymized — Local services brand

12-month campaign · Feb 2024 → Jan 2025
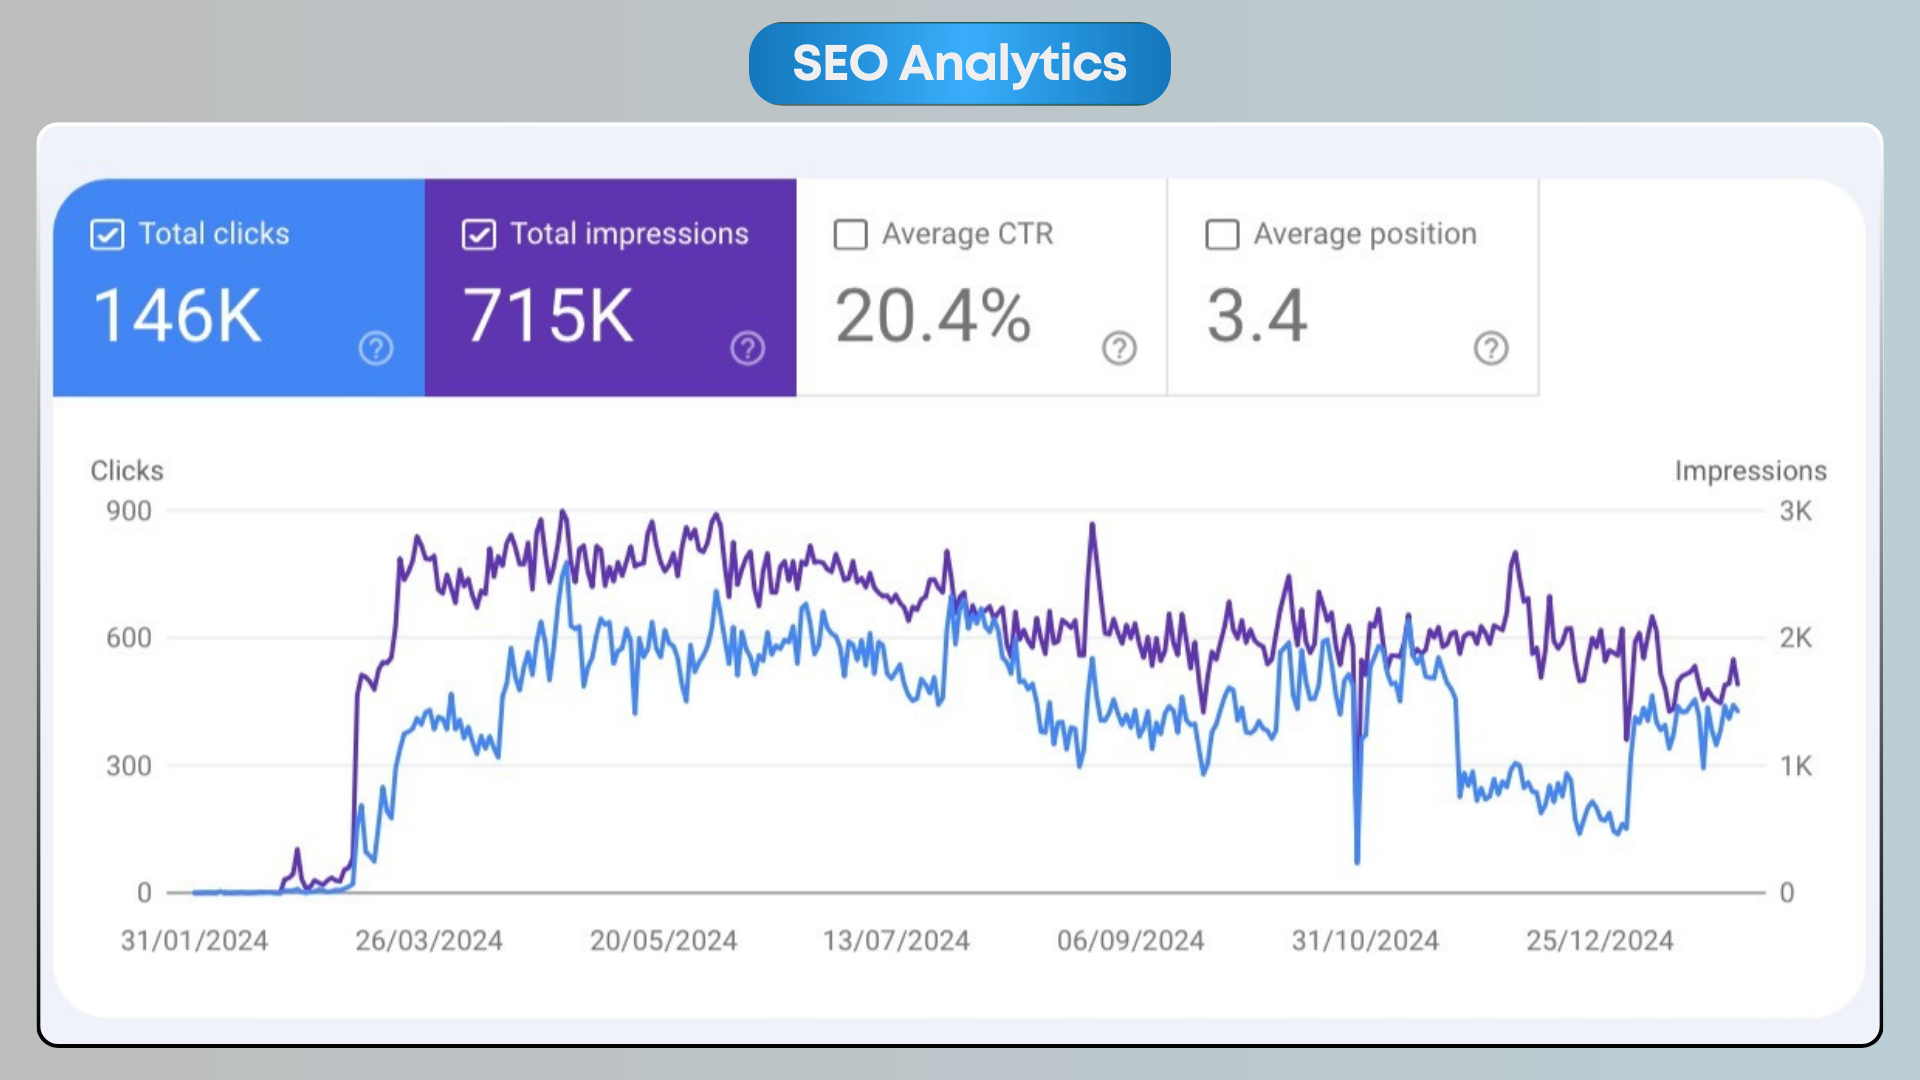
Google Search Console 12-month performance chart for an anonymized local services client showing clicks scaling from near-zero in February 2024 to a sustained band around 600 clicks/day by mid-2024, ending at 146K total clicks, 715K impressions, 20.4% CTR and 3.4 average position.
Clicks
146K
Impressions
715K
Avg CTR
20.4%
Avg position
3.4

Challenge

A young local services brand had almost zero organic visibility — flat clicks and impressions through January 2024, and no presence on the queries their customers were actually typing.

Result

Traffic broke out in late March 2024 and held. Over 12 months the site pulled 146K clicks at a 20.4% average CTR and settled at an average Google position of 3.4 — a step-change from effectively no visibility.
Digital Publisher Live result

Anonymized — News & publisher

30-day snapshot · March 2024

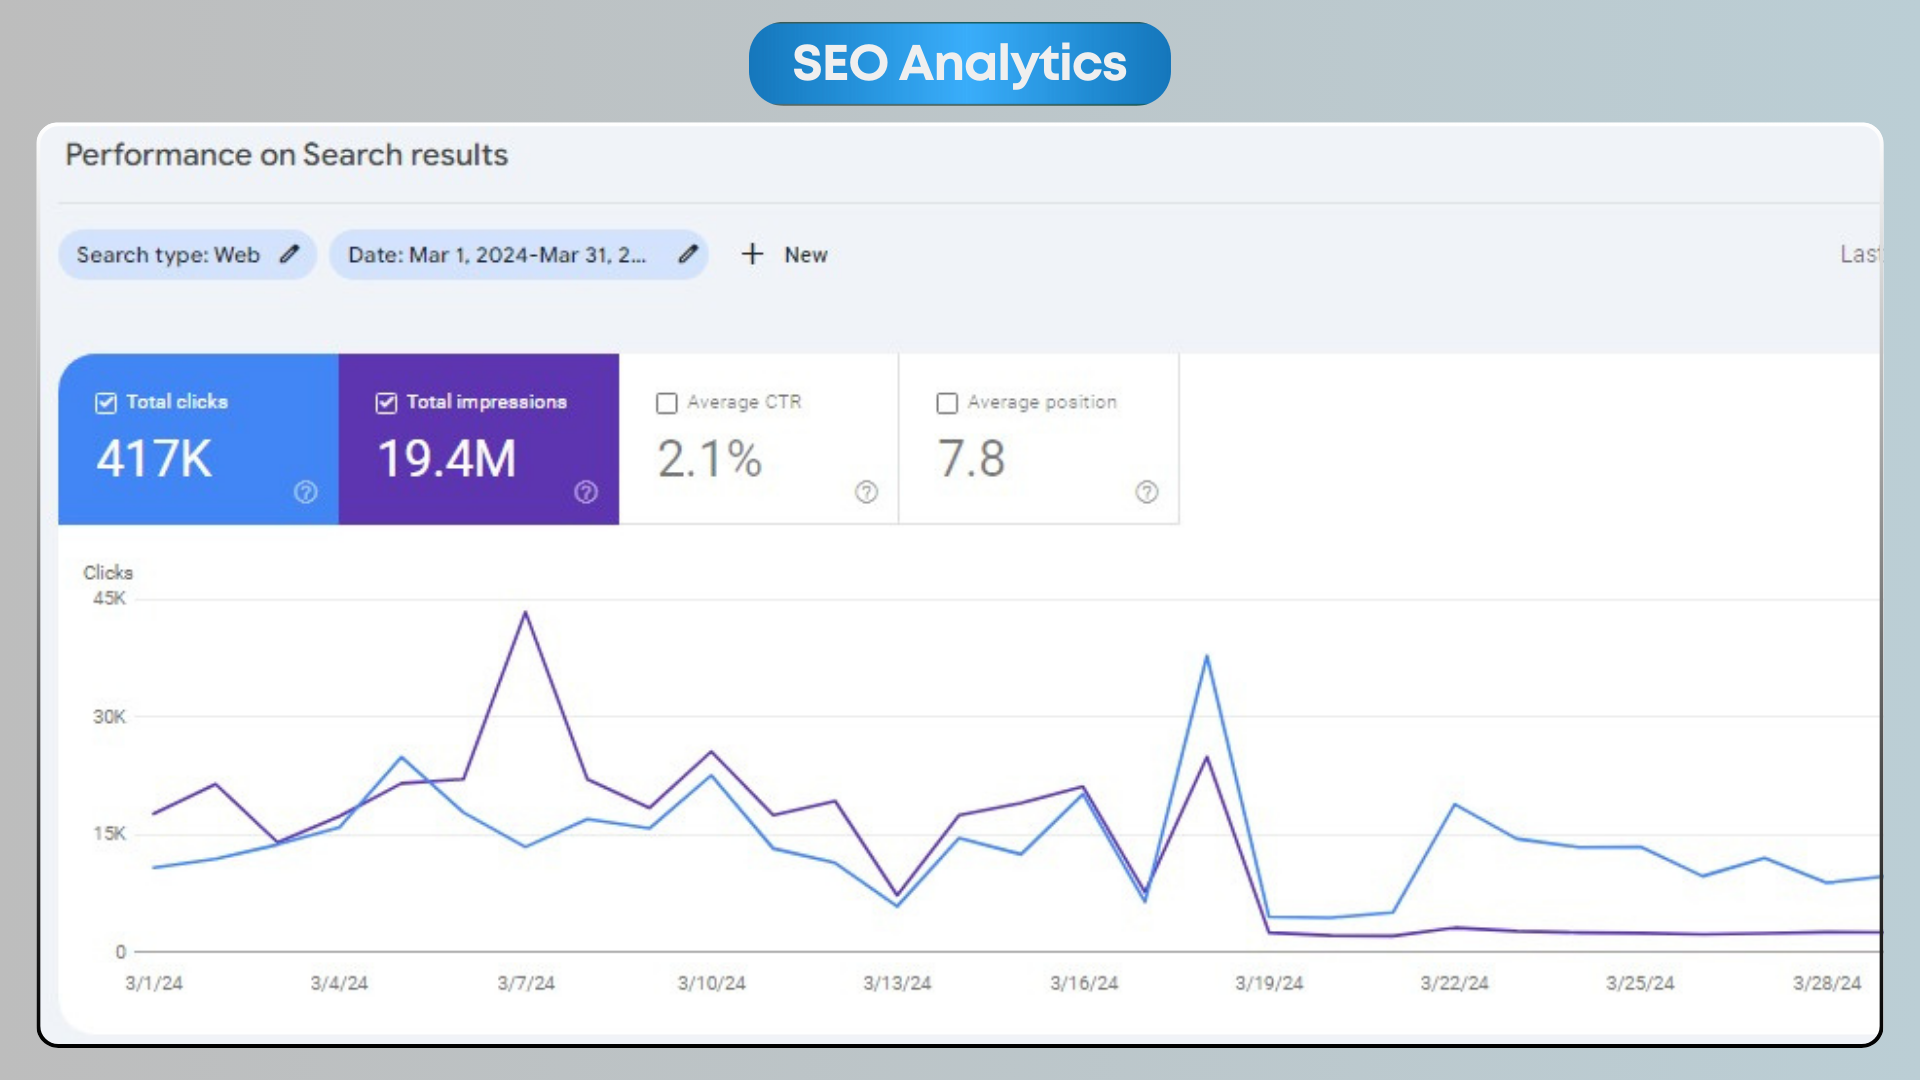
Google Search Console performance chart for an anonymized publisher covering March 1–31, 2024, showing daily clicks oscillating between 15K and 45K with a peak on March 7, ending the month at 417K clicks and 19.4M impressions.
Clicks
417K
Impressions
19.4M
Avg CTR
2.1%
Avg position
7.8

Challenge

A high-volume publisher was leaving traffic on the table: strong impressions but inconsistent CTR and volatile positions on evergreen story clusters.

Result

March 2024 alone delivered 417K clicks and 19.4M impressions with a 2.1% average CTR at position 7.8 — a healthy floor for a publisher operating at that impression scale.

B2B SaaS Live result

Anonymized — B2B SaaS

12-month campaign · Nov 2021 → Nov 2022

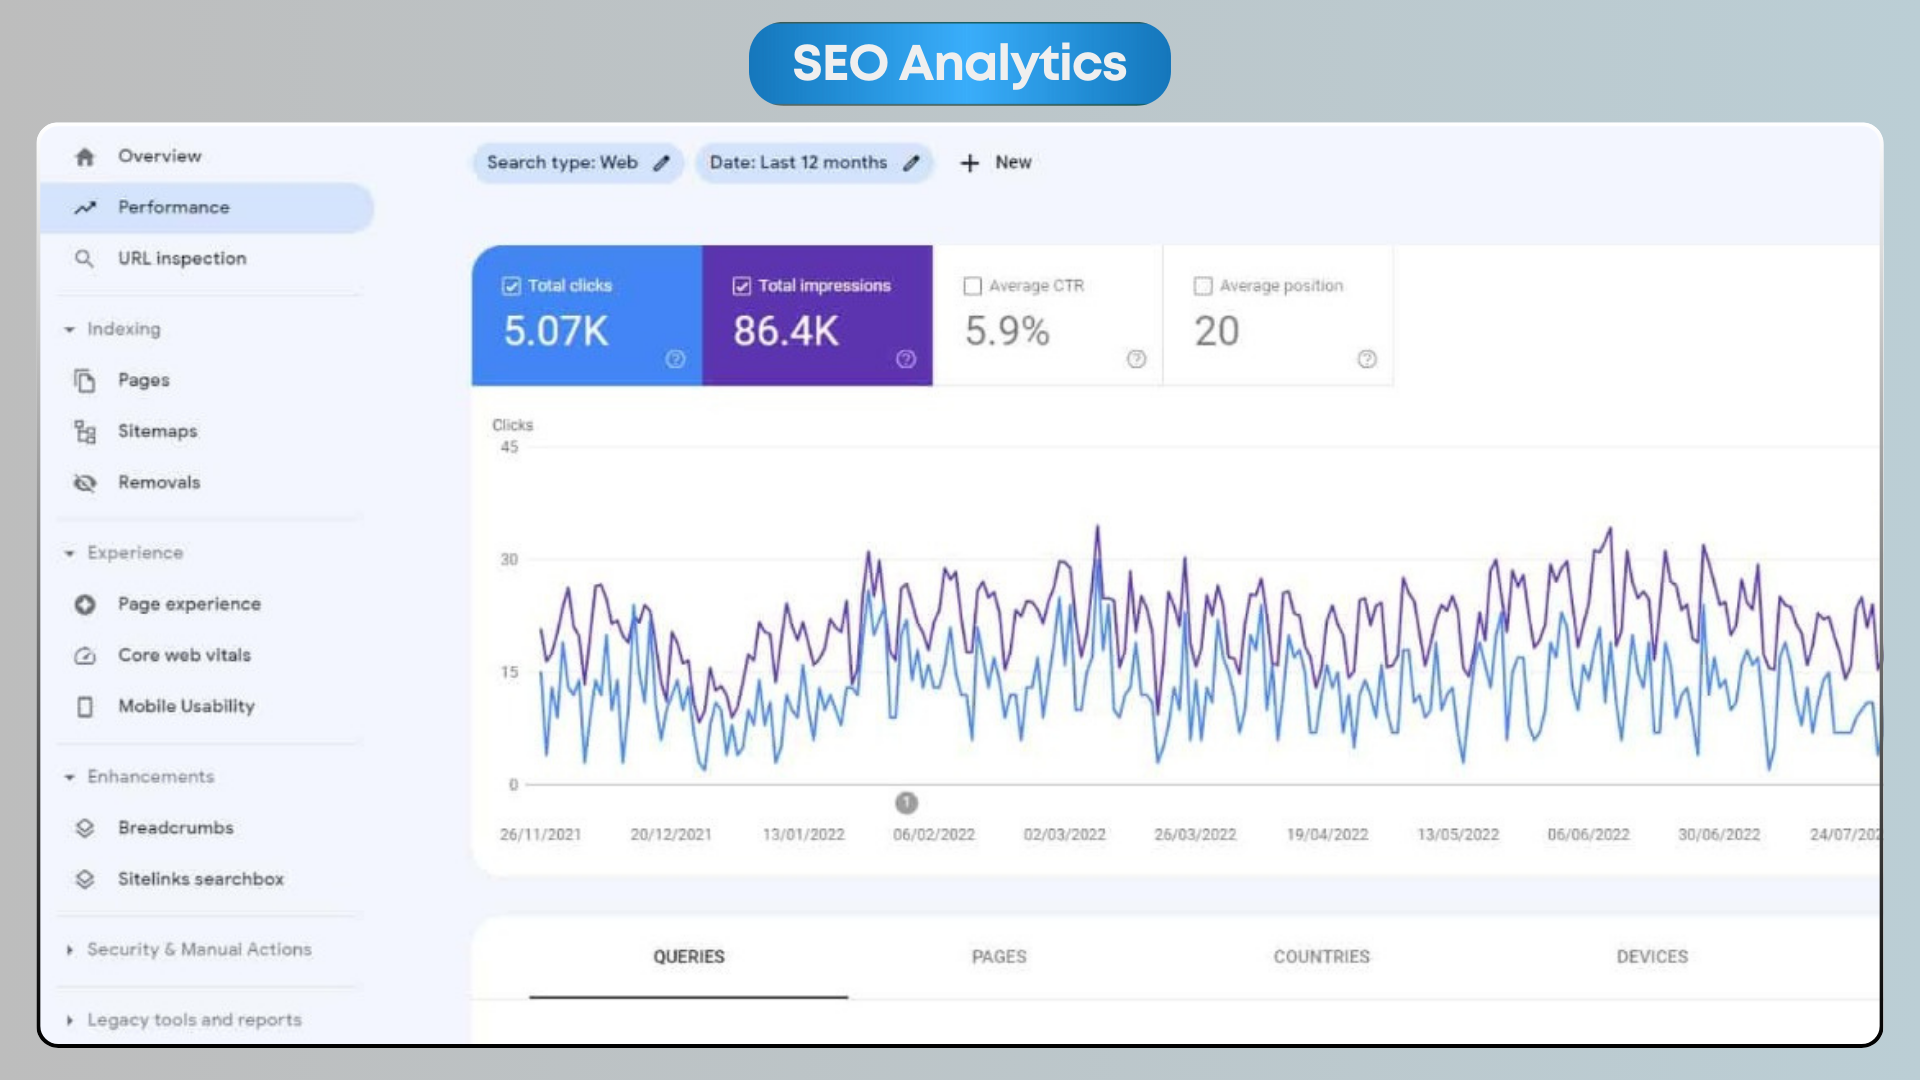
Google Search Console 12-month performance chart for an anonymized B2B SaaS client from November 2021 to November 2022 showing clicks steadily climbing from ~5 to ~30 per day, ending at 5.07K clicks, 86.4K impressions, 5.9% CTR and average position 20.
Clicks
5.07K
Impressions
86.4K
Avg CTR
5.9%
Avg position
20

Challenge

A niche B2B SaaS had a small but qualified addressable search market and was competing with much larger incumbents for bottom-of-funnel comparison and integration queries.

Result

Steady, compounding growth over 12 months: 5.07K clicks at a 5.9% CTR — a strong click-through for a technical audience — with average position at 20 as we pushed newer pages into the index.

E-commerce · D2C Live result

Anonymized — E-commerce brand

90-day snapshot

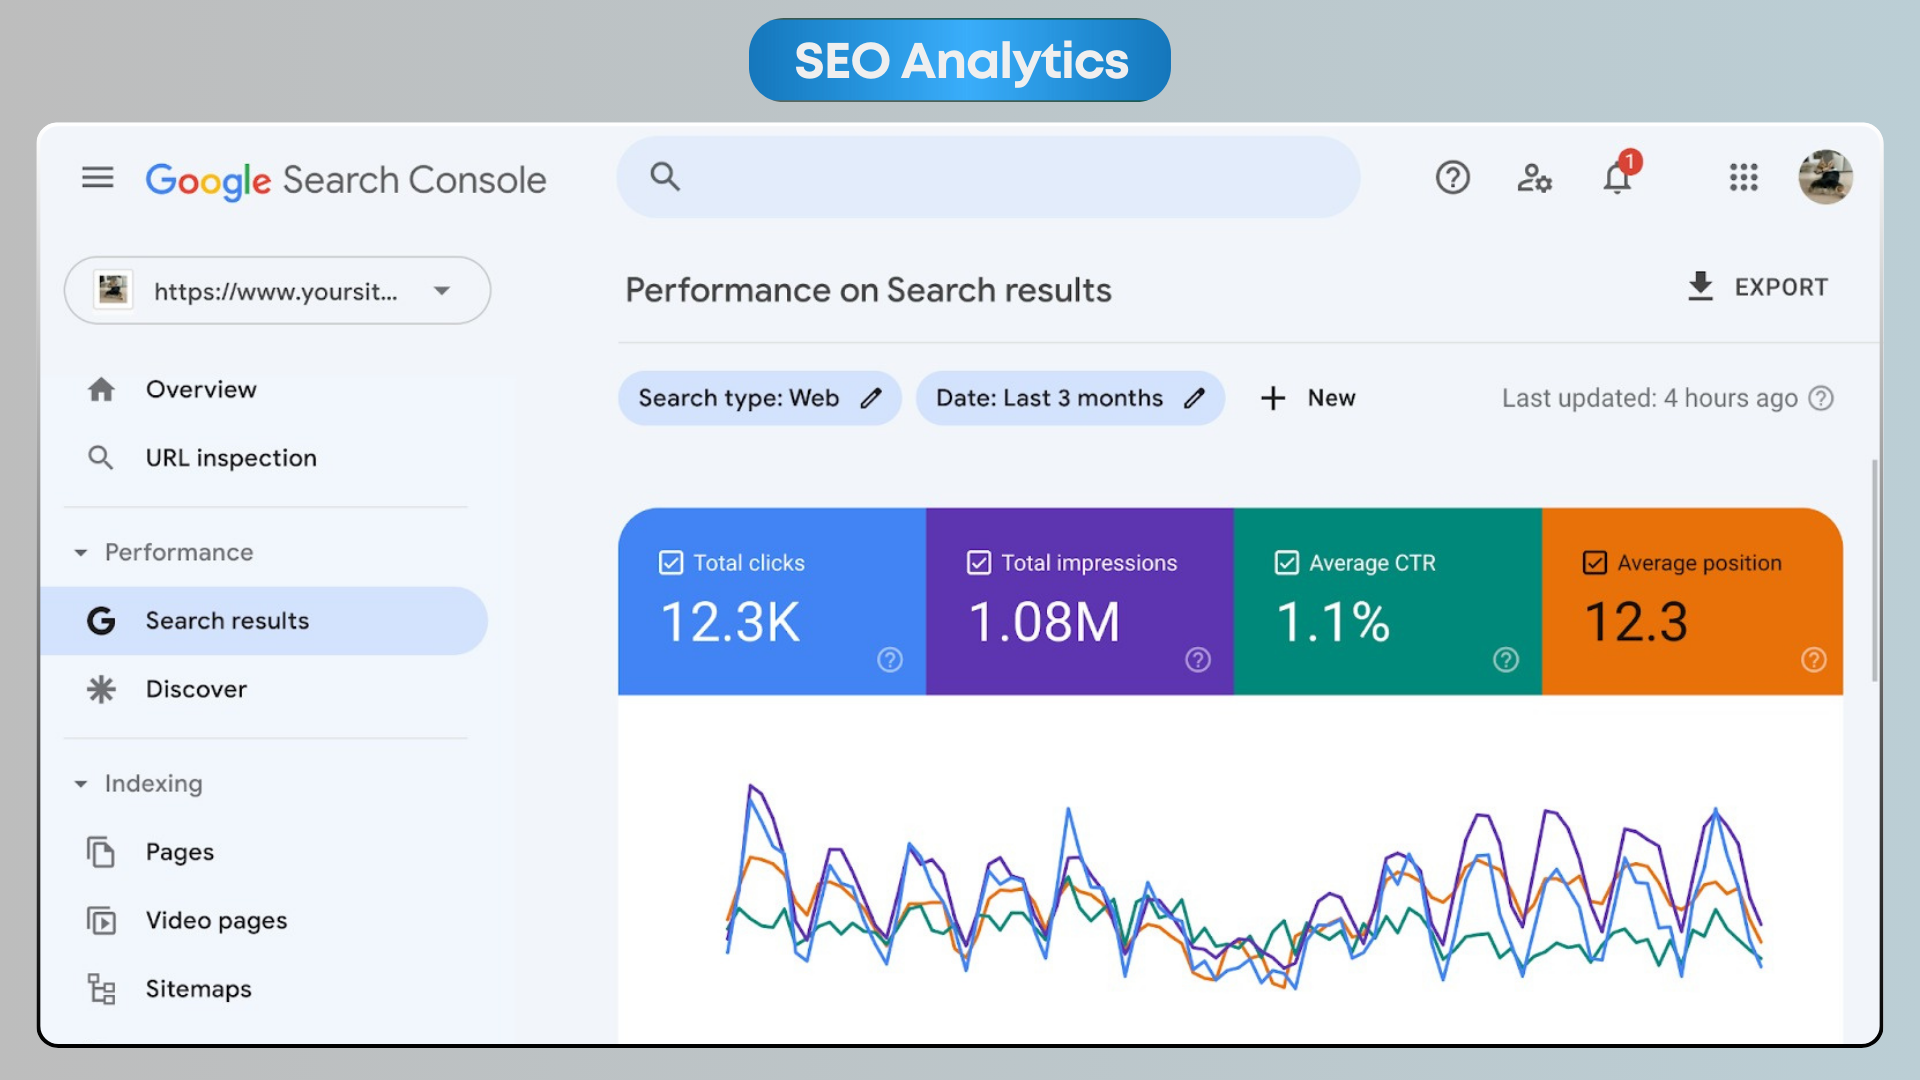
Google Search Console 90-day performance chart for an anonymized D2C e-commerce brand showing consistent daily clicks and impressions with three overlaid metric lines, ending at 12.3K clicks, 1.08M impressions, 1.1% CTR and average position 12.3.
Clicks
12.3K
Impressions
1.08M
Avg CTR
1.1%
Avg position
12.3

Challenge

A D2C brand had strong impressions on category-level queries but was ranking outside the top 10, so impressions were not converting into clicks.

Result

Over 90 days: 12.3K clicks against 1.08M impressions at an average position of 12.3 — the launching pad for a top-10 push in the following quarter.

Content · Niche vertical Live result

Anonymized — Niche content site

30-day snapshot · Jan 2025

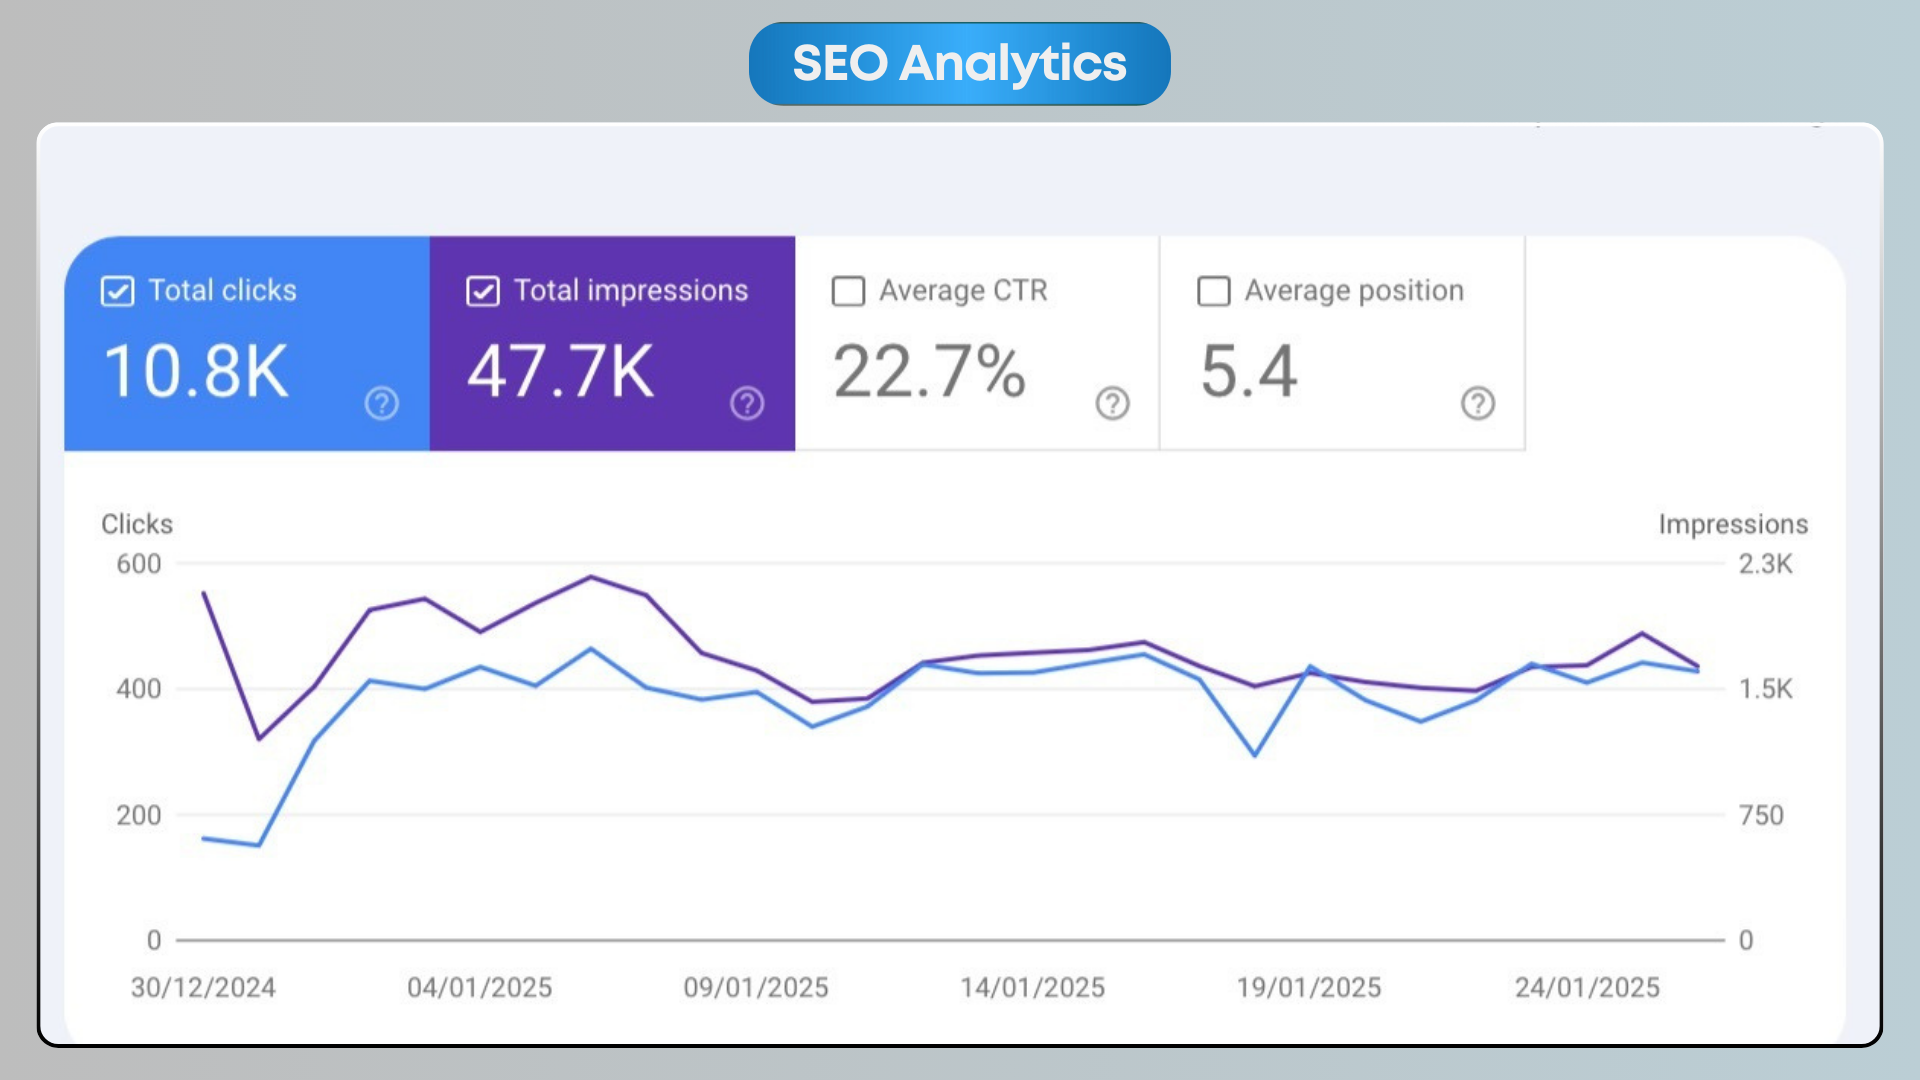
Google Search Console 30-day performance chart for an anonymized niche content site in January 2025 showing clicks (blue) and impressions (purple) tracking closely between 300 and 600 per day, ending at 10.8K clicks, 47.7K impressions, 22.7% CTR and average position 5.4.
Clicks
10.8K
Impressions
47.7K
Avg CTR
22.7%
Avg position
5.4

Challenge

A niche site was ranking but under-monetizing its impressions — titles and snippets weren't matching searcher intent, dragging CTR down.

Result

30 days later: 10.8K clicks from 47.7K impressions — a 22.7% average CTR at position 5.4. Clicks nearly matched impressions growth, which is the CTR-story you want to see.

D2C · Emerging brand Live result

Anonymized — D2C brand

90-day snapshot

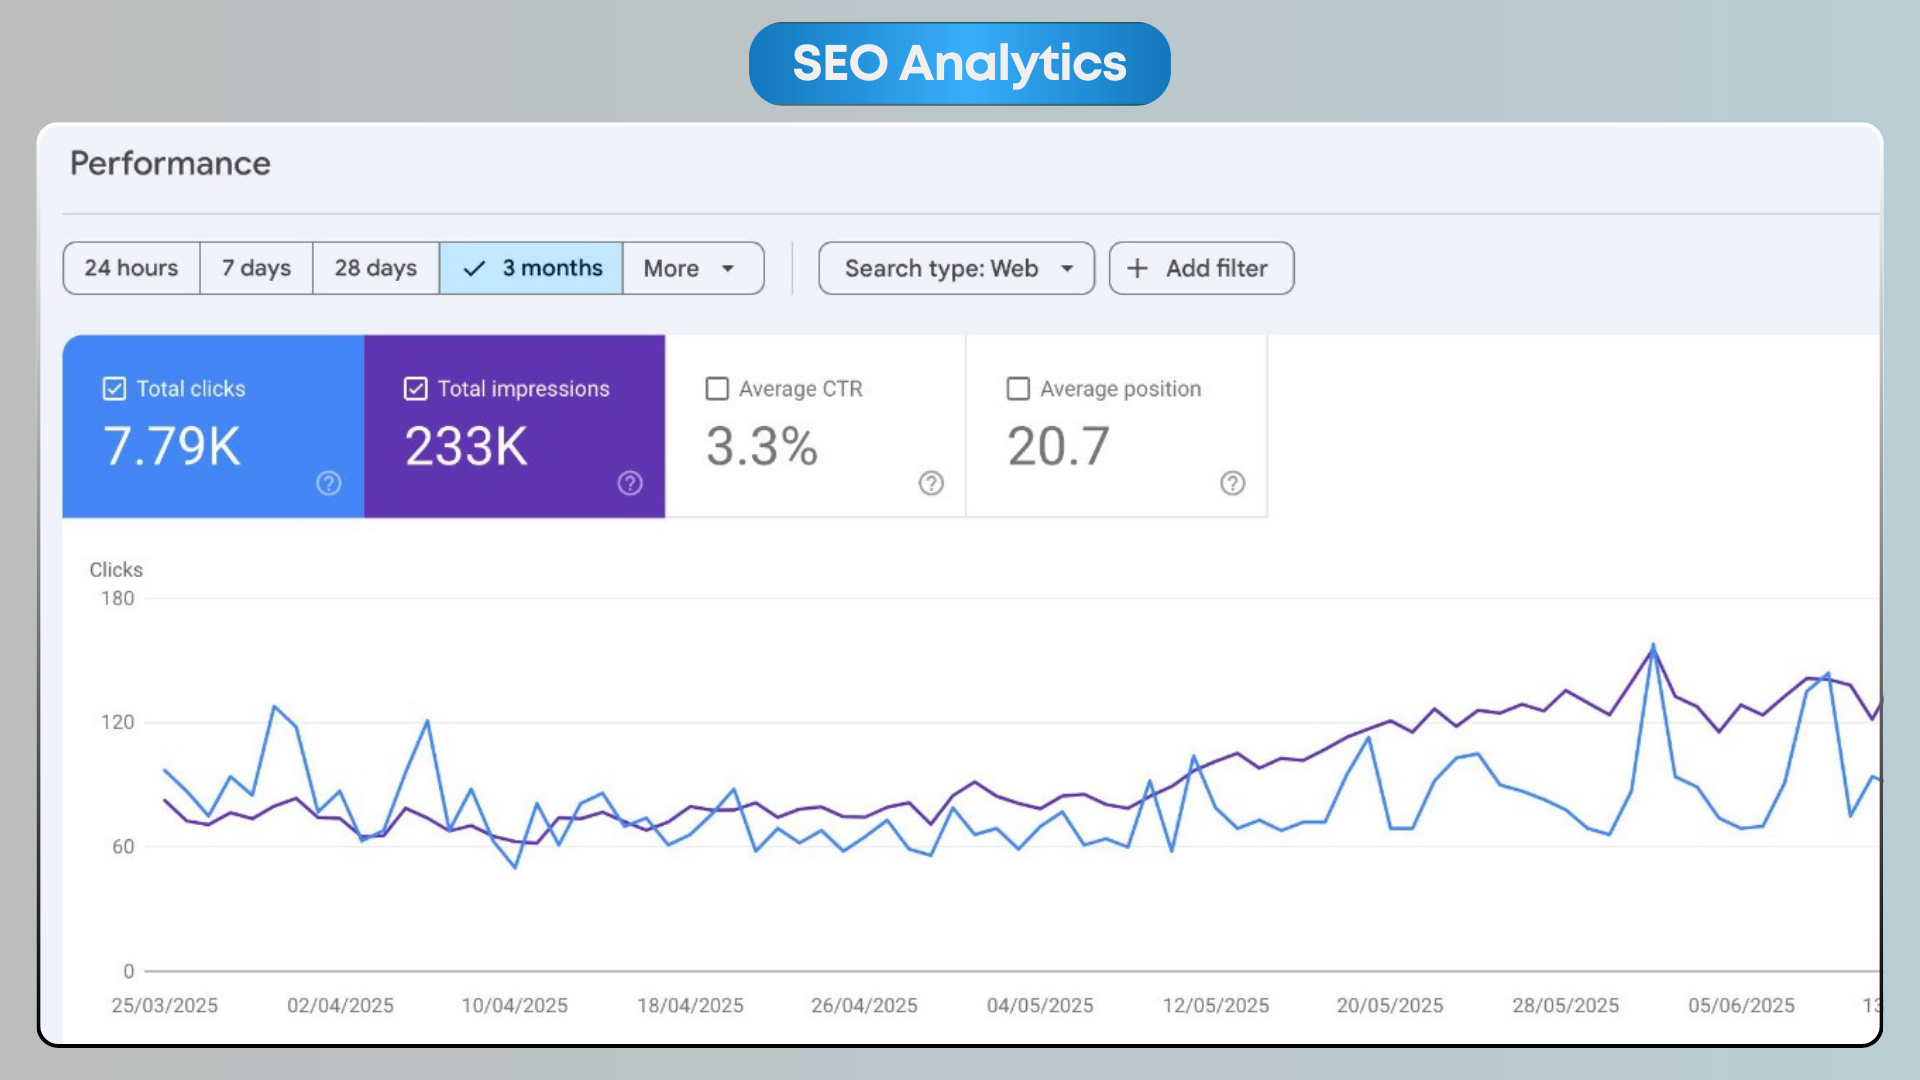
Google Search Console 3-month performance chart for an anonymized D2C brand from late March to mid-June 2025 showing clicks stable around 60–120/day and impressions climbing sharply in the final third of the window, ending at 7.79K clicks, 233K impressions, 3.3% CTR and average position 20.7.
Clicks
7.79K
Impressions
233K
Avg CTR
3.3%
Avg position
20.7

Challenge

A newer D2C brand had volatile daily clicks and impressions with no clear upward trend after their initial content push.

Result

In the same 90-day window, impressions inflected upward in the second half — 7.79K clicks and 233K impressions at 3.3% CTR — with the trend line pointing at a top-10 average position next quarter.

Online Education Live result

Anonymized — Online education portal

90-day snapshot

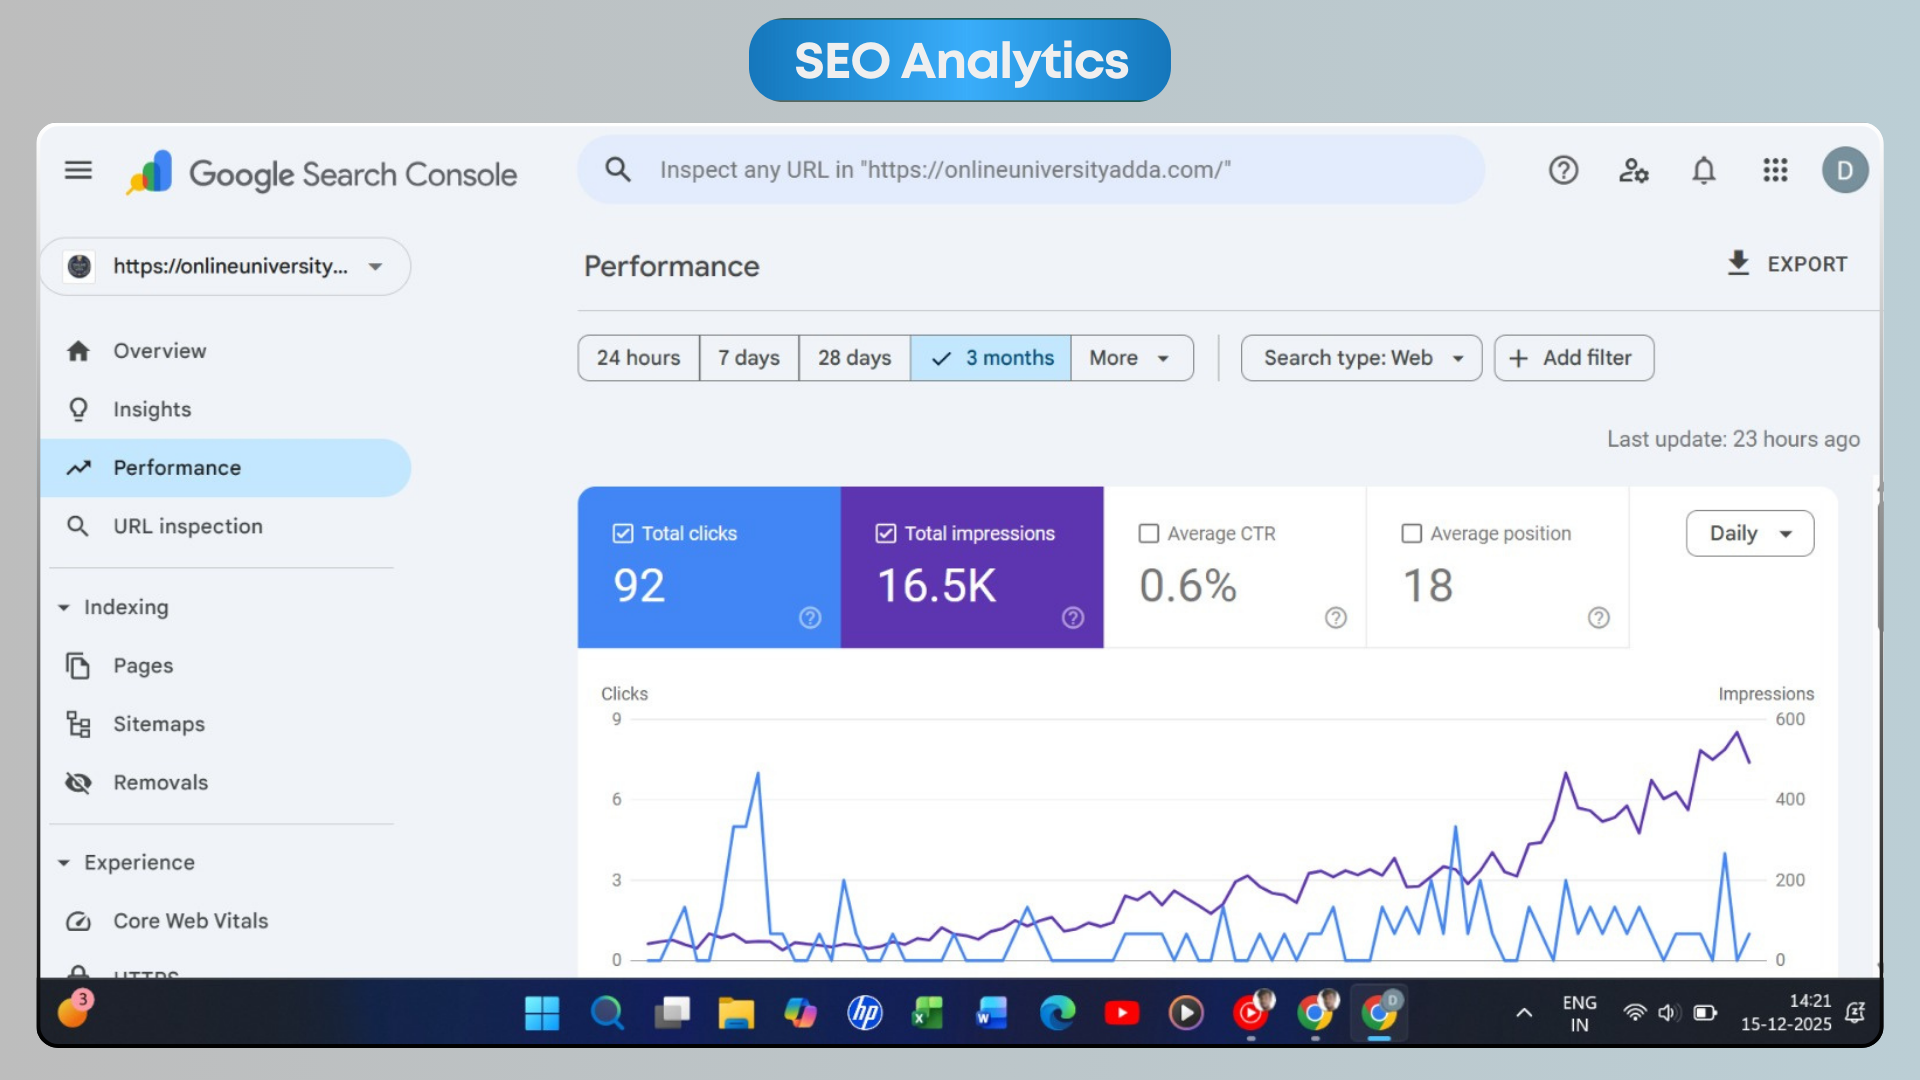
Google Search Console 3-month performance chart for an anonymized online education portal showing impressions rising steeply in the final month from near-zero to over 500/day, ending at 92 clicks and 16.5K impressions at 0.6% CTR and average position 18.
Clicks
92
Impressions
16.5K
Avg CTR
0.6%
Avg position
18

Challenge

A brand-new education portal launched with no organic footprint and needed to prove Google could crawl, index and start ranking the site before scaling content investment.

Result

Impressions climbed from near-zero to 16.5K in 90 days with a rising trend line and 92 clicks landing at an average position of 18. This is the early-signal phase — the ramp we look for before pushing content velocity.

Want to be our next case study?

We work with a small number of clients at a time so we can actually pay attention. If you're a fit, we'll show you exactly how we'd approach your growth.

Book a strategy call